Data Presentation
We have constructed a sgRNA library that targets the entire human genome, containing 63,950 sgRNA sequences. After the library construction, we conducted Sanger and NGS sequencing to detect the error rate, coverage, and uniformity of the library.
Low Error Rate
A batch of 30 clones was randomly selected for Sanger sequencing after completion of library construction. The sequencing results showed that 100% of the sgRNA sequences in the randomly selected clones matched the theoretical sequence completely.
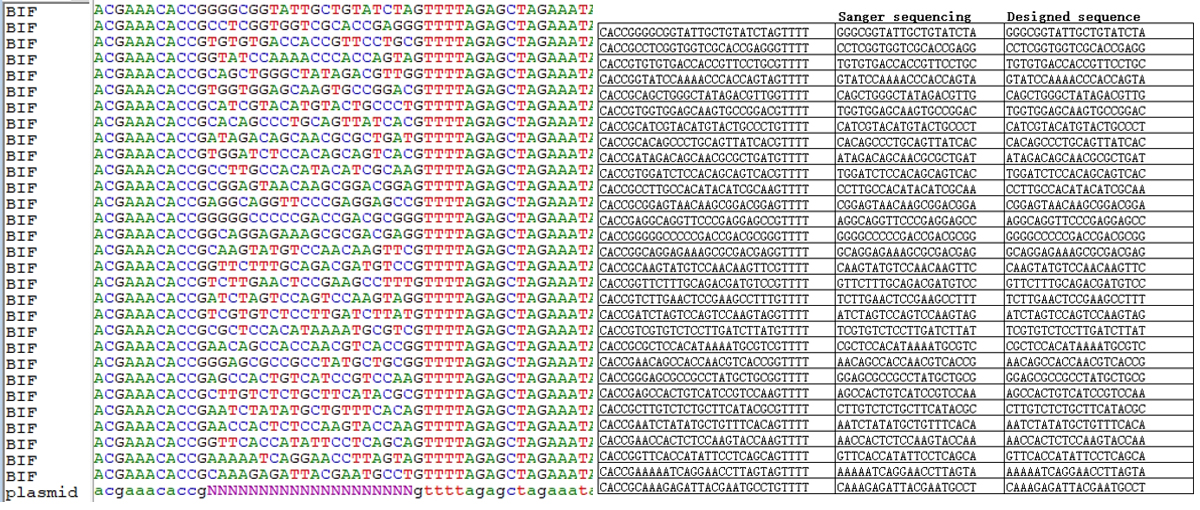
Figure1. Sanger Sequencing results
High coverage, uniform distribution, high stability between batches
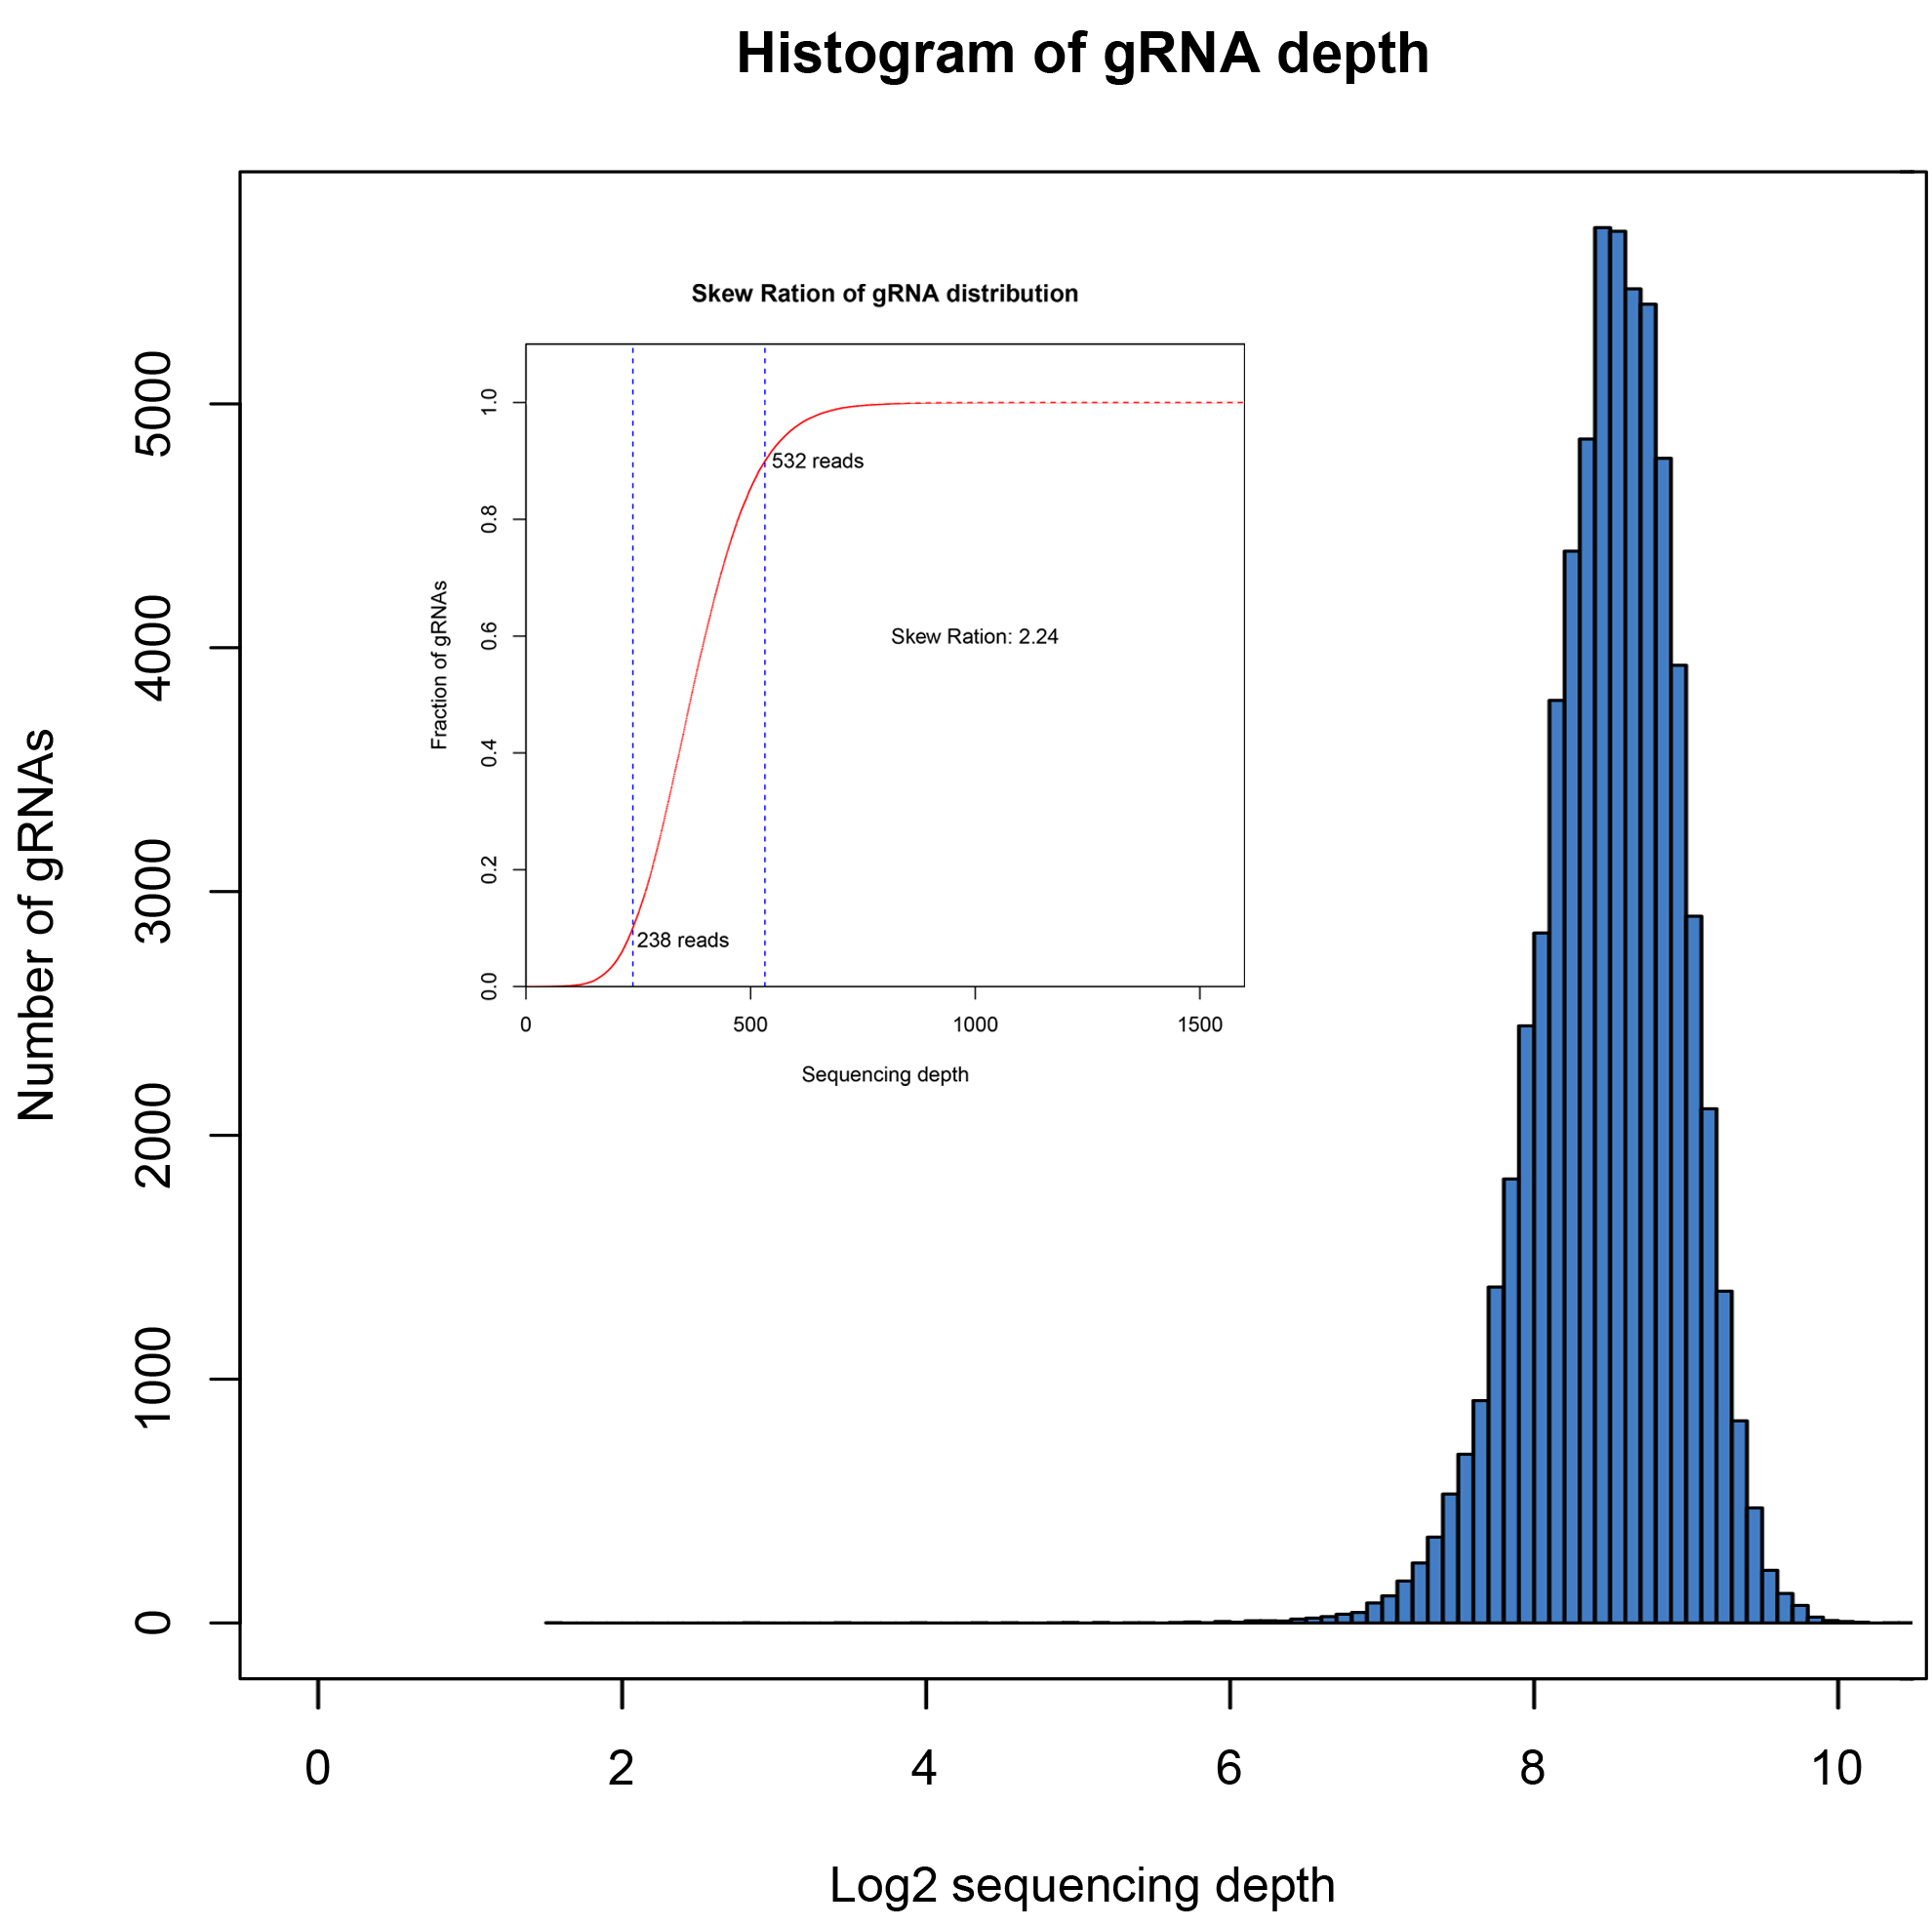
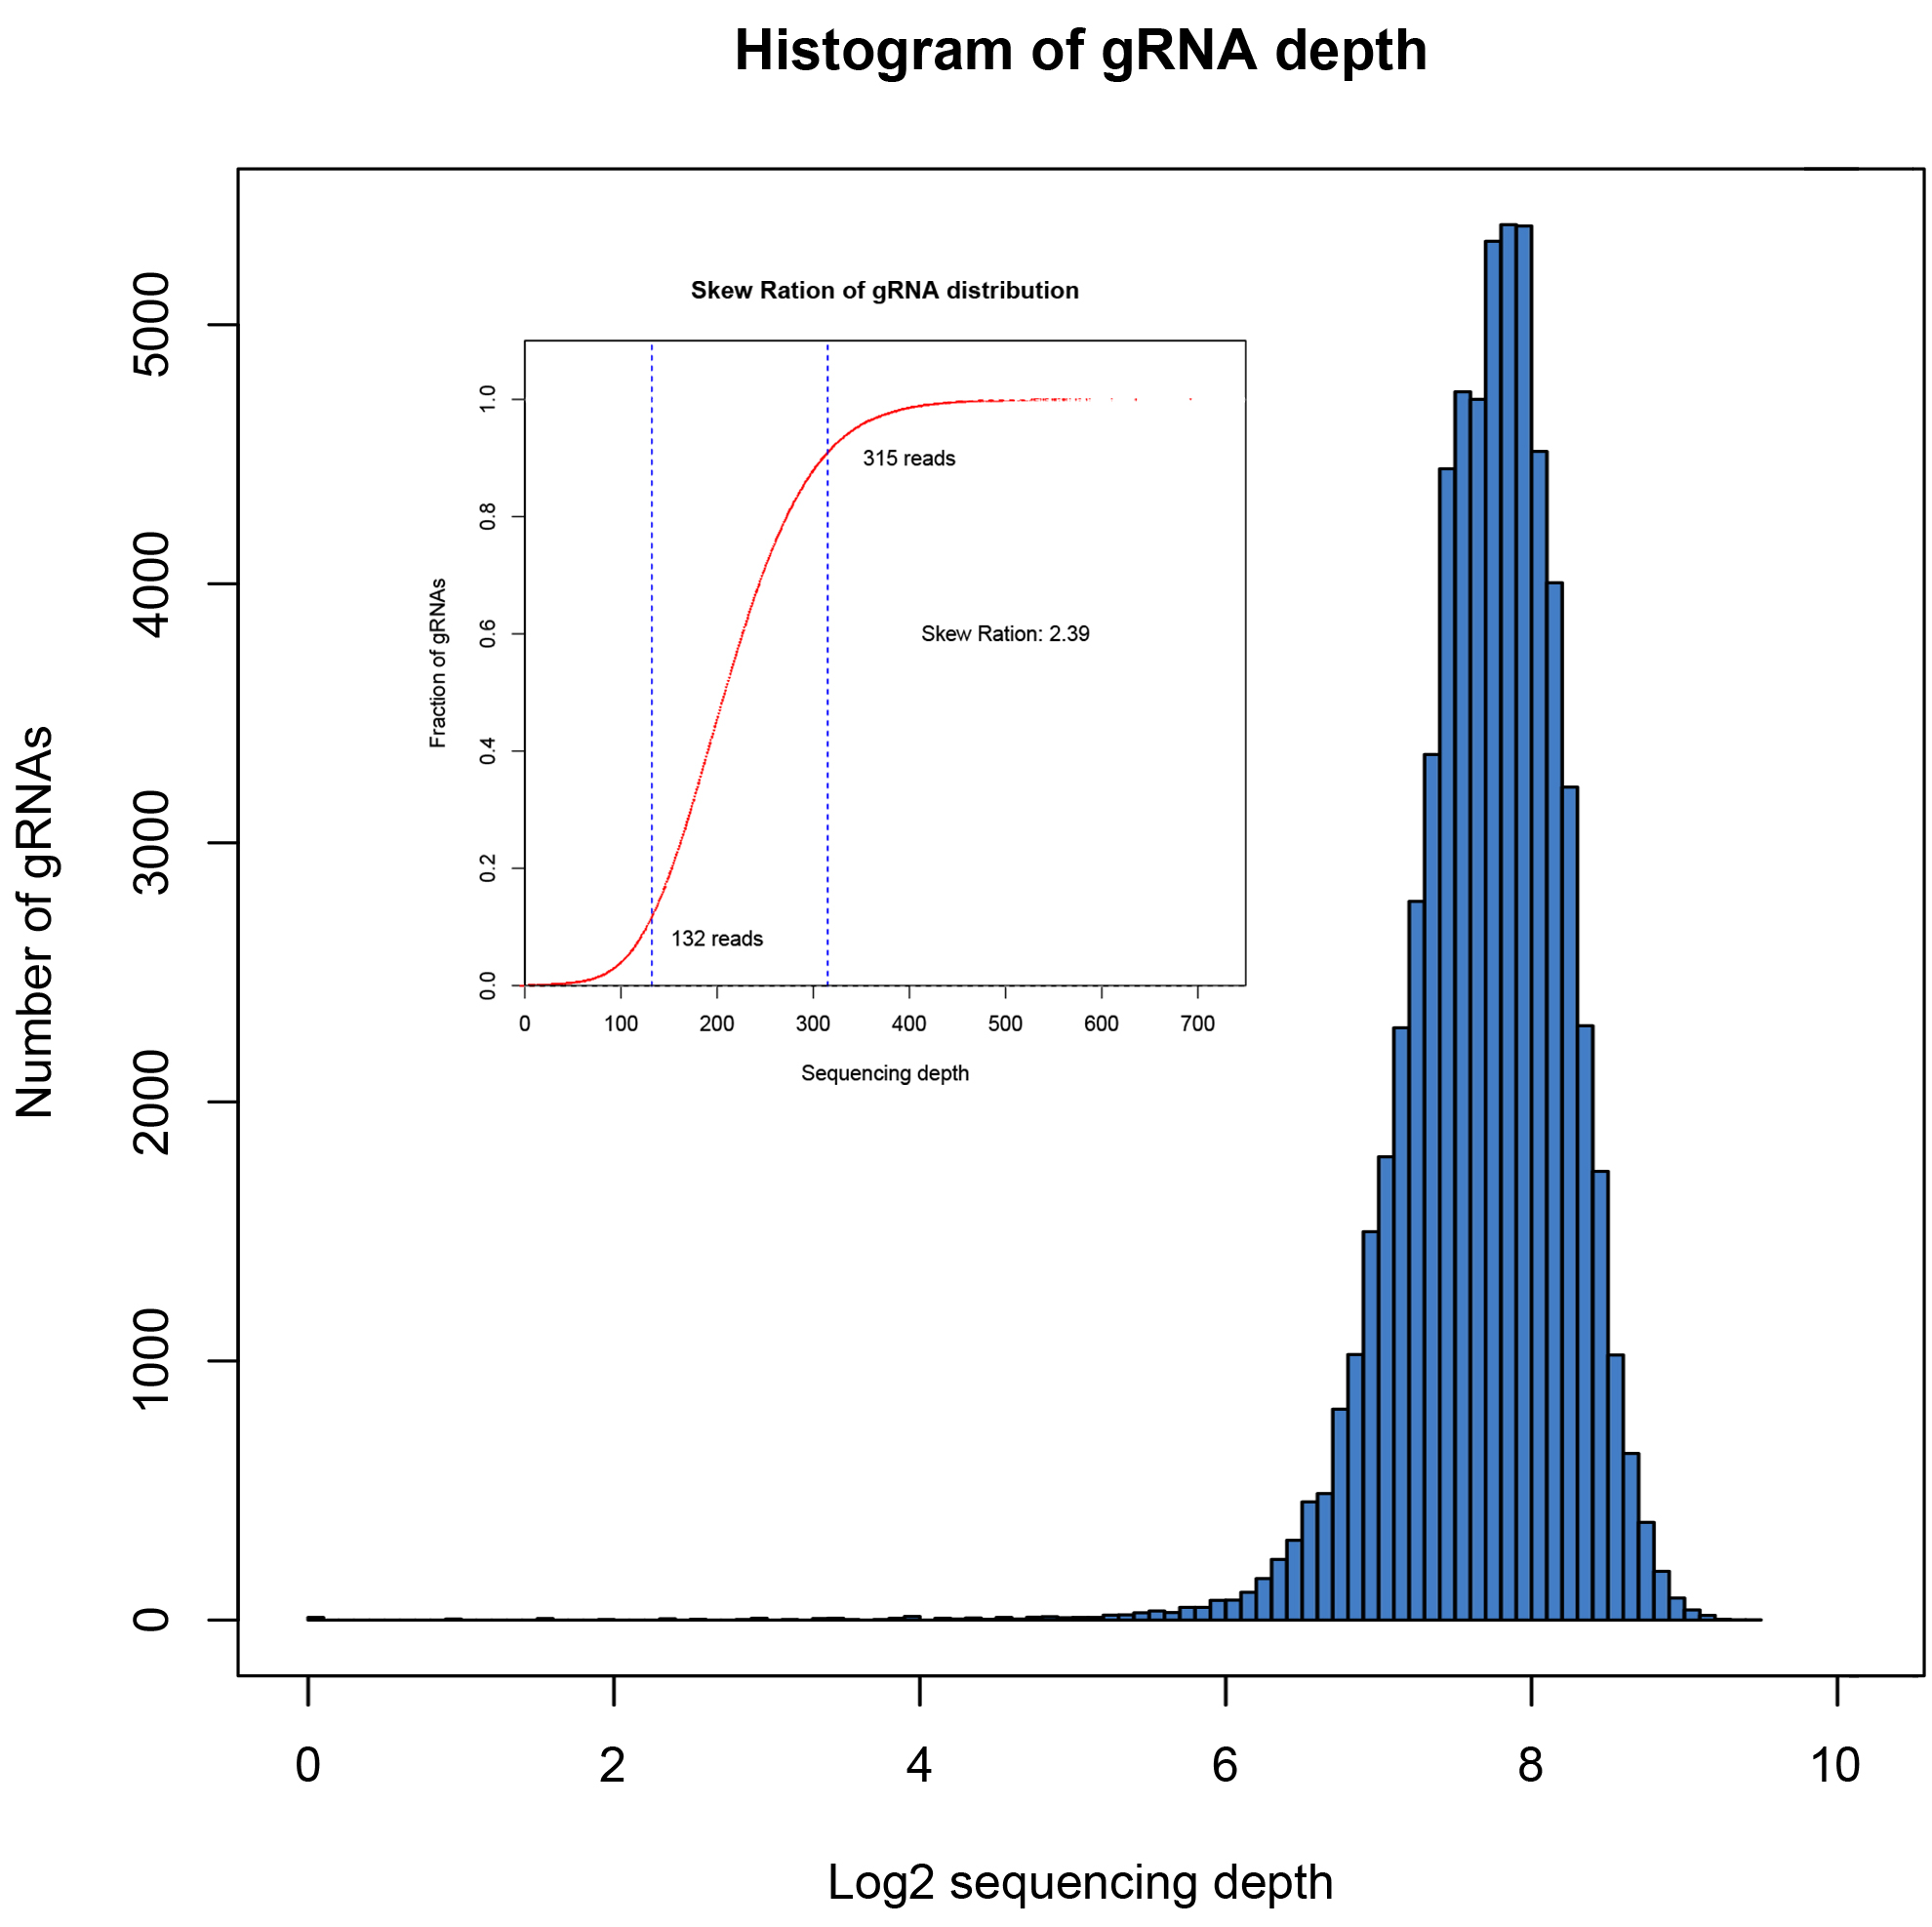
The coverage and distribution uniformity of the library are important indicators for evaluating the quality of the library. We used NGS to verify the coverage and stability between batches. Coverage refers to the proportion of actually detected sequences to designed target sequences included in the library. Ideally, different sgRNA sequences are evenly distributed in the library. However, due to inevitable bias introduction during the PCR and cloning processes, some sgRNA reads are relatively low, while others are relatively high. Therefore, uniformity is used to evaluate the distribution uniformity of sequences in the library. The distribution skew ratio is commonly used as a metric, with values <10 considered as a qualified library. The smaller the value, the better the uniformity.
We have built four batches of the library described above, and the NGS detection analysis results are as follows:
| Batch number |
Diversity of designed library |
Actual diversity of the library |
Coverage
|
Skew ratio |
| 01 |
63950 |
63950 |
100% |
2.24 |
| 02 |
63950 |
63940 |
99.98% |
2.39 |
| 03 |
63950 |
63937 |
99.98% |
2.91 |
| 04 |
63950 |
63943 |
99.99% |
2.29 |
 NGSHybridization Capture DNA Probe QuarStar Liquid Pan-Cancer Panel 3.0 QuarStar Pan-Cancer Lite Panel 3.0 QuarStar Pan-Cancer Fusion Panel 1.0 QuarStar Pan Cancer Panel 1.0 Hybridization Capture RNA Probe QuarXeq Human All Exon Probes 3.0 HRD panel Library Preparation DNA Library Preparation Kit Fragmentation Reagent mRNA Capture Kit rRNA Depletion Kit QuarPro Superfast T4 DNA Ligase Hybridization Capture QuarHyb Super DNA Reagent Kit QuarHyb DNA Plus 2 Reagent Kit QuarHyb DNA Reagent Kit Plus QuarHyb One Reagent Kit QuarHyb Super Reagent Kit Pro Dynegene Adapter Family Dynegene Blocker Family Multiplex PCR QuarMultiple BRCA Amplicon QuarMultiple PCR Capture Kit 2.0 PathoSeq 450 Pathogen Library Corollary Reagent Streptavidin magnetic beads Equipment and Software The iQuars50 NGS Prep System
 Primers and Probes
 RNA SynthesissgRNA miRNA siRNA
 Gene Synthesis
 Oligo Pools
 CRISPR sgRNA Library
 Antibody Library
 Variant Library


 Tel: 400-017-9077
 Address: Floor 2, Building 5, No. 248 Guanghua Road, Minhang District, Shanghai
 Email: